Note: This is deprecated as collaboration with PyInvesting is not active anymore.
This tutorial will share how you can now use PyInvesting together with StocksCafe to create your own robo-advisor and track its performance.
This was written in collaboration between Ivan from PyInvesting and Evan from StocksCafe. The similarity in name is just a coincidence, we are not related 🙂
You will learn how to:
- Define your investment universe (StocksCafe)
- Create a backtest with this investment universe (PyInvesting)
- Analyze your backtest results (PyInvesting)
- Create your robo-advisor (PyInvesting)
- Track your portfolio’s performance live (StocksCafe)
Tip: Receive a special 30% discount on the PyInvesting monthly subscription fees, by signing up through this link.
Define your investment universe (StocksCafe)
In this tutorial, we will define our investment universe to be stocks in the Straits Times Index (STI).
To define your investment universe, head over to StocksCafe’s screener tool.
- Fill in your screener name and description then click on the green “+ Add More Conditions” button.

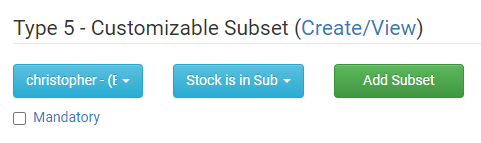
- Expand the “Advanced Condition Types” and scroll down to “Type 5 – Customizable subset”. Choose “christopher – (ERM) STI Singapore Component Stocks”. In the other dropdown we will select “Stock is in Subset”.
- Next hit the green “Add Subset” button.
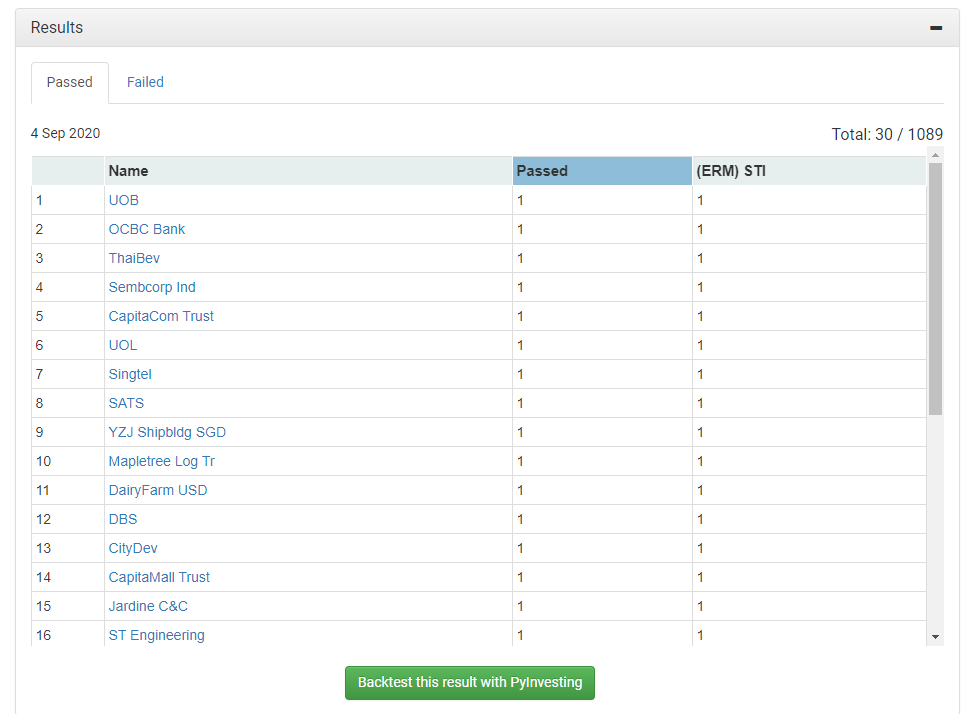
- You will be brought back to the main page. To run the screen, click on the green “Run” button. It will generate a table of 30 stocks from the Straits Times Index.
- Finally, click on the green button at the bottom to backtest your screen results with PyInvesting.
Create a backtest with this investment universe (PyInvesting)
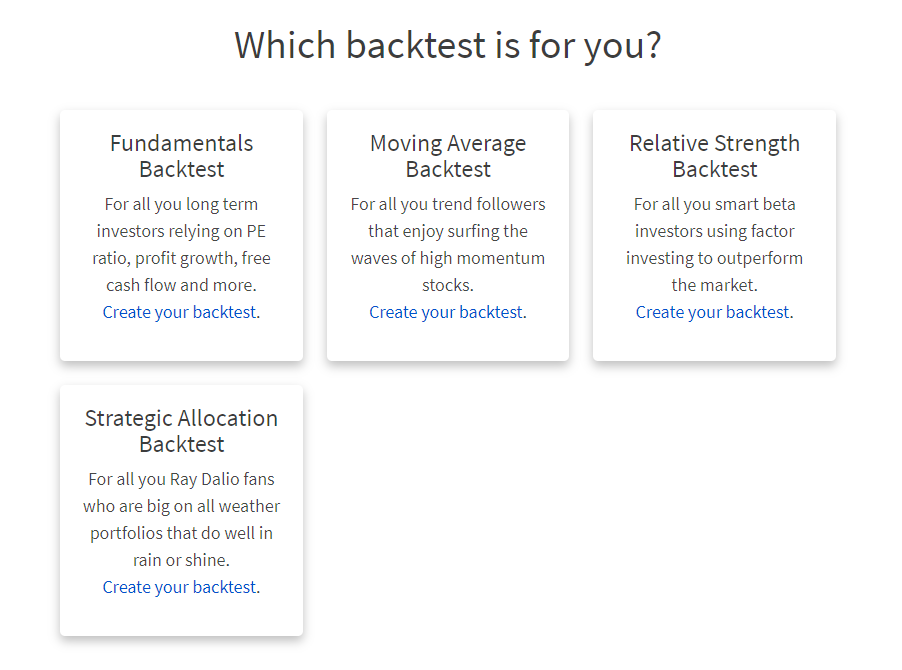
It will direct you to PyInvesting where you will be able to backtest your investment strategy using stocks that have passed the screen. There are currently 4 types of backtests that you can choose from.
In this example, we will be using the Fundamentals Backtest, so go ahead and click on that option.
You will be directed to a form where you have to fill in the details for your fundamentals backtest. In the first section, your investment universe will be auto-populated with stocks from the Straits Times Index that were defined in our screen results earlier.
The benchmark is the SPDR Straits Times Index ETF (ES3.SG) and you can add/change it if you like.

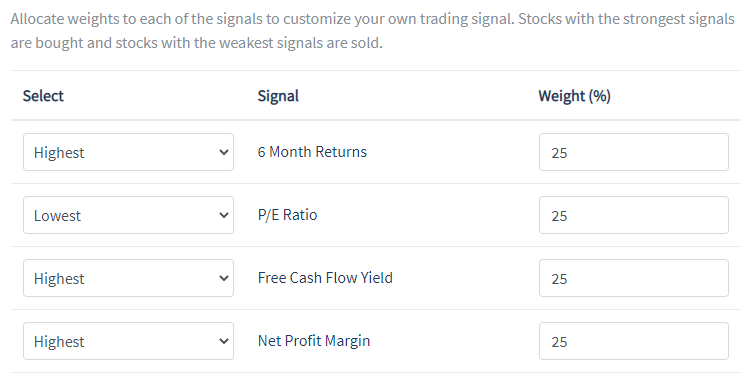
Next, we will be selecting the factors that our strategy will use to rank our stocks in our defined universe.
For this tutorial, we will assign an equal weightage of 25% to the four signals (i.e. the lowest PE ratio, highest 12 month returns (momentum factor), highest free cash flow yield, and highest net profit margin). These factors are combined (using their z-score) to form the buy/sell/hold signal.
Stocks with higher price momentum will be ranked higher because price trends tend to persist. Research has shown that stocks that have had strong returns over the past 6 months tend to have great returns going forward.
Stocks with lower price to earnings ratios will be ranked higher because lower price to earning is deemed as cheaper.
Stocks with higher free cash flow yield will be ranked higher because higher free cash flow yield indicates a better ability to generate cash flow relative to their price after accounting for cash needed to maintain their capital assets.
Stocks with higher net profit margins were chosen because they are deemed more efficient in using their assets to generate value for their customers.
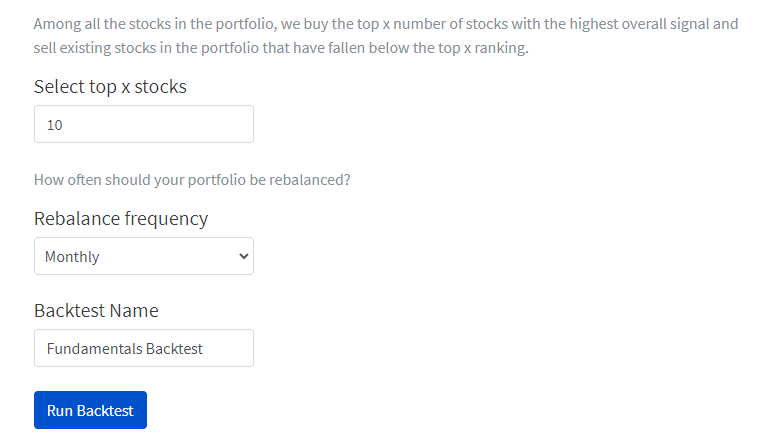
For this tutorial, we will hold 10 stocks in our portfolio and rebalance our portfolio every month to select stocks with the strongest fundamentals.
Fill in the details and hit “Run Backtest”.
Analyze your backtest results (PyInvesting)
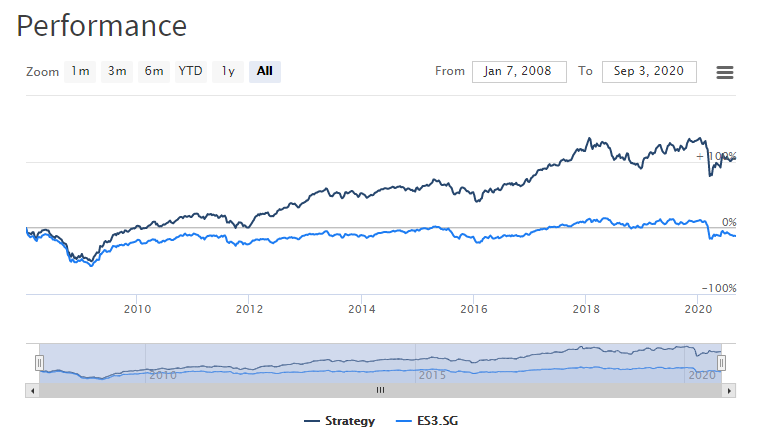
PyInvesting will then simulate your investment strategy using historical data to test whether the strategy works (at least historically).
Based on the results from 7 Jan 2008 and 3 Sep 2020, our backtest shows that the strategy makes an annualized return of 7.4% vs the Straits Times Index which loses 1% on average every year.
The Sharpe ratio of our strategy is also much higher at 0.33 vs the STI which is -0.32 (risk free = 3%). This implies that our strategy generates higher risk-adjusted returns than the benchmark.
Create your robo-advisor (PyInvesting)
Next, you can go live with this investment strategy by simply clicking on “Go live with this strategy”. This will create a robo-advisor which will send you daily email updates with live orders for us to trade on our personal brokerage account to follow the strategy.

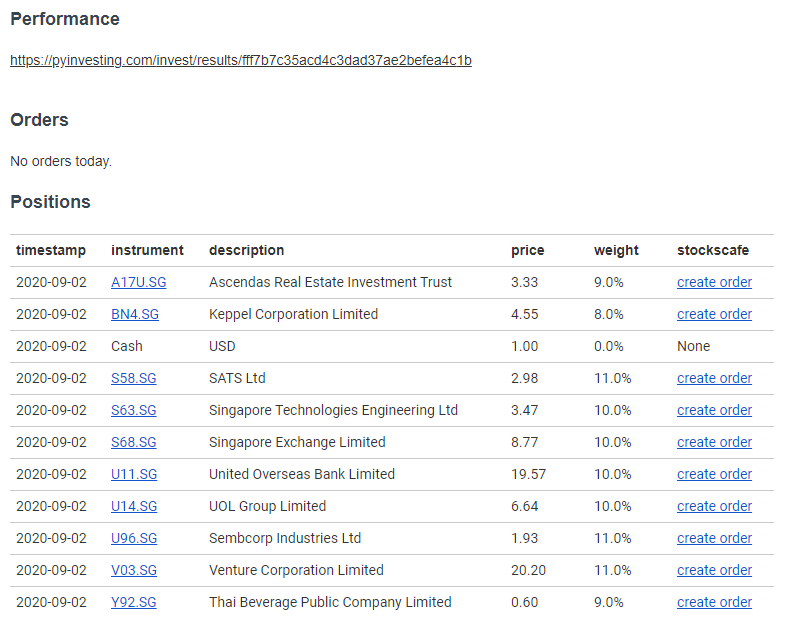
Below is an example of the email that you might receive after going live with our strategy. It will show the backtest performance, any orders the strategy recommends and the current weight of each stock in our portfolio.
The StocksCafe column in the table below contains the links for users to create a transaction directly on StocksCafe to track the live performance of this investment strategy.
Track your portfolio’s performance live (StocksCafe)
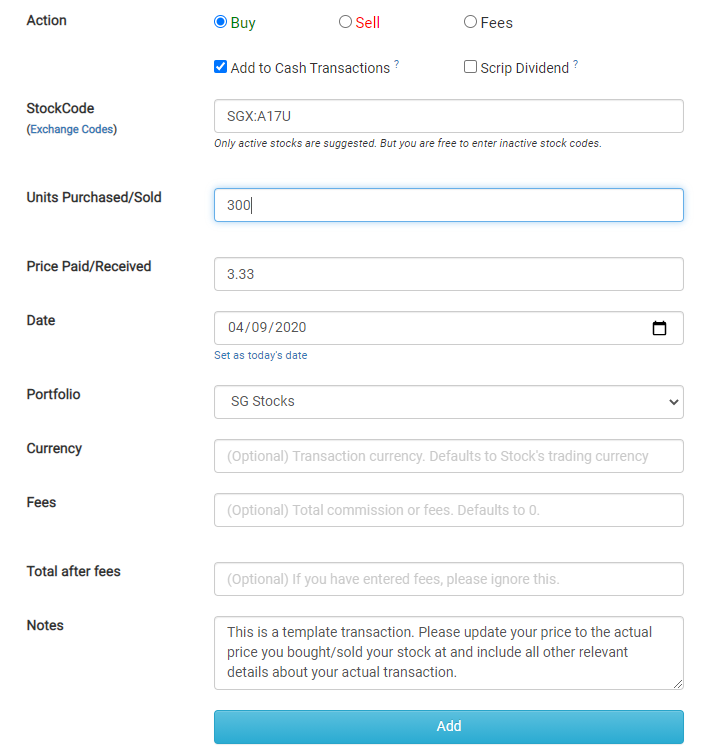
Go ahead and click on “create order” for the first instrument, Ascendas REIT and you will be directed to StocksCafe where some of the fields such as the ticker, buy/sell action, date and price have been populated for you.
Do note that the price used was the previous day’s close price and it should be modified to the price which you bought the stock at. We also need to fill in the quantity of stocks we bought or sold so that the number matches what the robo-advisor recommended.
This will mean using 10% of the portfolio’s value to buy each of the 10 stocks in the table above.
For example, if your portfolio is $10,000, allocate 10% of that value (which is $1000) to buy each of the 10 stocks. For the first counter, Ascendas REIT, you will be able to buy $1000/$3.33 = 300 lots after rounding down. Do the same for the other 9 counters.
After filling in your transactions, you will be able to view the performance analytics of your portfolio. For instance, in the overview tab shown below, we can see that Venture was our best performing stock in the portfolio which is up 12.29% since it was purchased. Keppel Corp was our worst performing stock which has lost 14.26% since its purchase.

Final Thoughts
By using PyInvesting and StocksCafe together, we were able to create our own robo-advisor using a strategy that selects stocks with strong fundamentals, backtest the strategy, and track our portfolio’s live performance.
These tools will help us adopt a data-driven approach to investing where we make our decisions based on a set of rules rather than based on emotional decisions to buy or sell based on news headlines.
As part of our collaboration, you will receive a special 30% discount on the PyInvesting monthly subscription fees, by signing up through this StocksCafe referral link. Furthermore, the first month is free and you can cancel anytime. If you are keen backtesting and/or creating your own rule-based investment strategies, this is a good chance to try out PyInvesting!